우선 윈도우 디버깅 툴이 비스타 64bit를 지원할까? 확인해 봅시다.
1. Debugging Tools for Windows - Overview
http://www.microsoft.com/whdc/DevTools/Debugging/default.mspx
(VISTA x64를 지원한다)
2. 다운로드 및 설치
Debugging Tool과 현재 PC에 설치된 운영체제와 같은 버전의 VISTA SP1 심볼을 다운로드 받은 뒤 설치.
symbols 의 설치 경로는 기본 설정에 따릅니다. (C:\Windows\symbols)
http://msdl.microsoft.com/download/symbols/debuggers/dbg_amd64_6.8.4.0.msi
Windows Vista SP1 RTM symbols
http://msdl.microsoft.com/download/symbols/packages/Windows2008/Windows_Longhorn.6001.080118-1840.x86fre.Symbols.exe
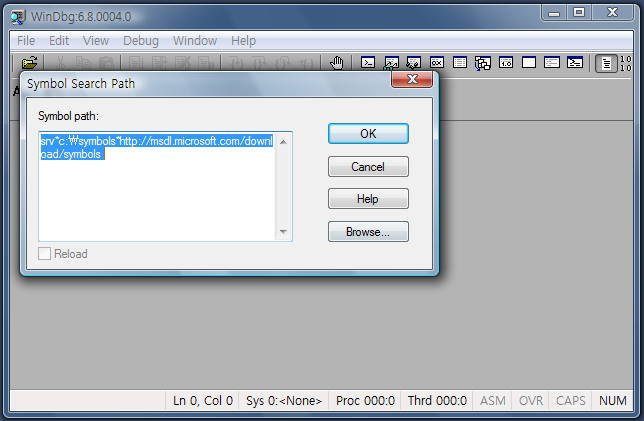
3. 심볼 환경 설정
핫픽스에 대한 업데이트 된 심볼을 사용하기 위해서는 웹 심볼을 이용할 수 있습니다.
인터넷 심볼로부터 요청된 심볼을 불러올 수 있도록 아래와 같이 설정합니다.
srv*c:\symbols*http://msdl.microsoft.com/download/symbols
4. Crash 덤프 파일 불러오기
일반적으로 메모리 덤프 파일은 %systemroot% 폴더에 MEMORY.DMP 파일로 존재합니다.
File - Open Crash Dump (Ctrl + D) 메뉴를 이용해서 파일을 불러옵니다.
[실행 결과] - Sample
1: kd> !analyze -v
*******************************************************************************
* *
* Bugcheck Analysis *
* *
*******************************************************************************
DRIVER_IRQL_NOT_LESS_OR_EQUAL (d1)
An attempt was made to access a pageable (or completely invalid) address at an
interrupt request level (IRQL) that is too high. This is usually
caused by drivers using improper addresses.
If kernel debugger is available get stack backtrace.
Arguments:
Arg1: 0000000000000010, memory referenced
Arg2: 0000000000000002, IRQL
Arg3: 0000000000000001, value 0 = read operation, 1 = write operation
Arg4: fffff980008926ce, address which referenced memory
Debugging Details:
------------------
Page ba6cd not present in the dump file. Type ".hh dbgerr004" for details
PEB is paged out (Peb.Ldr = 00000000`7efdf018). Type ".hh dbgerr001" for details
PEB is paged out (Peb.Ldr = 00000000`7efdf018). Type ".hh dbgerr001" for details
WRITE_ADDRESS: 0000000000000010
CURRENT_IRQL: 2
FAULTING_IP:
ndis!ndisXlateSendCompleteNetBufferListToPacket+3e
fffff980`008926ce 48c7411036434f4d mov qword ptr [rcx+10h],4D4F4336h
DEFAULT_BUCKET_ID: VISTA_DRIVER_FAULT
BUGCHECK_STR: 0xD1
PROCESS_NAME: iexplore.exe
TRAP_FRAME: fffff980260e1130 -- (.trap 0xfffff980260e1130)
NOTE: The trap frame does not contain all registers.
Some register values may be zeroed or incorrect.
rax=fffffa80088030b0 rbx=fffff800024df714 rcx=0000000000000000
rdx=fffff980260e1348 rsi=0000000000000002 rdi=fffffa8008728b70
rip=fffff980008926ce rsp=fffff980260e12c0 rbp=fffffa8007144d90
r8=fffff980260e1340 r9=fffffa8008705e40 r10=0000000000000000
r11=00000000000003df r12=0000000000000000 r13=0000000000000000
r14=0000000000000000 r15=0000000000000000
iopl=0 nv up ei pl zr na po nc
ndis!ndisXlateSendCompleteNetBufferListToPacket+0x3e:
fffff980`008926ce 48c7411036434f4d mov qword ptr [rcx+10h],4D4F4336h ds:0002:00000000`00000010=????????????????
Resetting default scope
LAST_CONTROL_TRANSFER: from fffff8000204da33 to fffff8000204dc90
STACK_TEXT:
STACK_COMMAND: kb
FOLLOWUP_IP:
Rtlh64!MiniportSendNetBufferList+247
fffff980`02a889d7 488d8df8040000 lea rcx,[rbp+4F8h]
SYMBOL_STACK_INDEX: 7
SYMBOL_NAME: Rtlh64!MiniportSendNetBufferList+247
FOLLOWUP_NAME: MachineOwner
MODULE_NAME: Rtlh64
IMAGE_NAME: Rtlh64.sys
DEBUG_FLR_IMAGE_TIMESTAMP: 45190cf7
FAILURE_BUCKET_ID: X64_0xD1_W_Rtlh64!MiniportSendNetBufferList+247
BUCKET_ID: X64_0xD1_W_Rtlh64!MiniportSendNetBufferList+247
......작성자 : Lai Go / 작성일자 : 2008.04.30